Cost of Renewable Electricity
Learning objectives
In this chapter, we will learn more about the dramatic decrease in cost of renewable electricity wit-nessed over the last decade. We focus on the modern and variable sources ? wind and solar energy and look at both their cost of generation and system cost. At the end of the chapter, the reader will be able to:
- Cost development in wind and solar electricity
- Recent tender results
- Cost drivers: equipment, O&M, resource quality, cost of capital
- Definition of “total system costs” or “integration costs” of renewables
1. The boom in wind and solar power
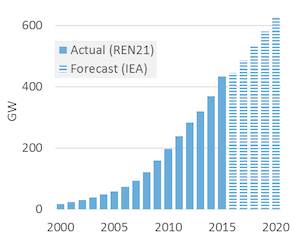
Capacity additions. Until recently, the only renewable energy source that held a significant market share in the global electricity supply was hydroelectricity. Wind power started gaining traction in the first decade of the 21st century and has witnessed rapid growth since 2010, with about 50 GW additions to generation capacity annually (Figure 1). Solar power is the newest entrant on the scene. Meaningful additions to global solar capacity started only after 2010, with about 40 GW annual capac-ity additions since then (Figure 2).
| Figure 1. Cumulative global wind power capacity | Figure 2. Cumulative global solar power capacity |
|---|---|
| Key point: During the past 15 years more than 400 GW of wind power capacity was added. | Key point: Before 2010 total solar capacity was very small, but has increased rapidly since then. |
 |
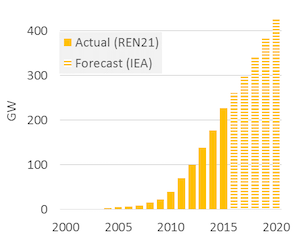 |
| Source: OEE, based on data from REN21 (2017) and IEA (2017) | Source: OEE, based on data from REN21 (2017) and IEA (2017) |
Renewables over take fossil fuels. The year 2015 marked a turning point. For the first time ad-ditions to renewable energy based generation capacity were greater than additions to conventional fossil fuel based capacity, and the trend has continued since.
Figure 3. Share of renewables in annual additions to global capacity
Key point: In 2015, more than half of additions generation capacity was based on renewable energy.
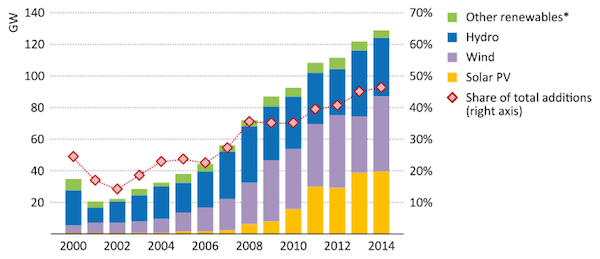
Source: IEA
A global phenomenon. In the early 2000s renewable energy investments were concentrated in a handful of European countries, but this is no longer the case. Today, the five BRICS countries operate more renewable capacity than the 28 EU member countries. China alone has more than three times the installed wind power capacity as Germany (Figure 4).
Figure 4. Renewable power capacity additions by region
Key point: Renewable power investments are globally well dispersed.
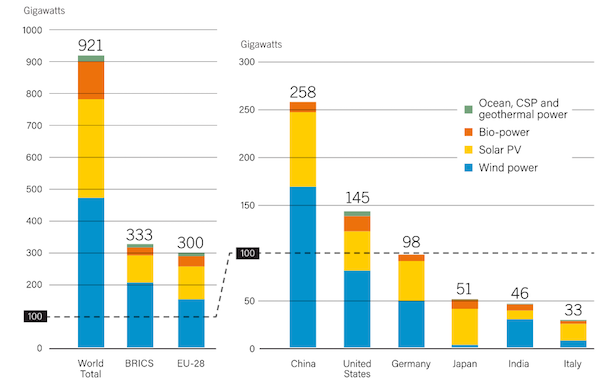
Source: REN21 (2017) Global renewables status report
Generation share. In spite of the impressive increase in generation capacity, the share of wind and solar power in total electricity generation (in MWh terms) is a mere 5 percent. This is because wind and solar power plants have a capacity factor of 10-40 percent, compared to a factor of 60-95 percent for most thermal power plants.
| Source | Global generation share |
|---|---|
| Coal | 41% |
| Natural gas | 22% |
| Hydro | 16% |
| Nuclear | 11% |
| Biomass, wind, solar | 6% |
| Oil | 4% |
Source: IEA Key World Energy Statistics 2016
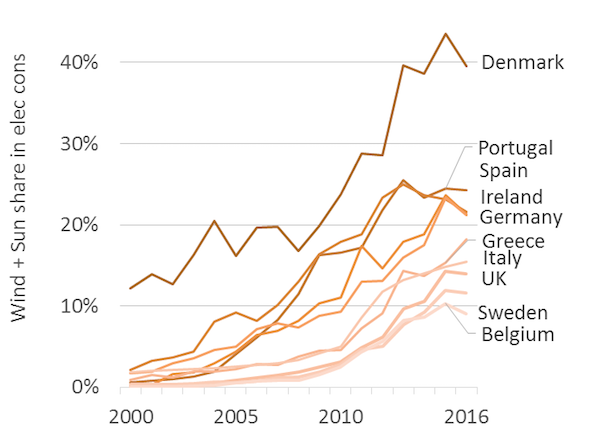
High penetration of renewables. But in individual regions these renewable energy sources have gained a much higher share. In 9 out of 33 IEA member countries, wind and solar power supplies more than 10 percent of electricity demand, with the Demark being the clear leader at 40 percent. On the Iberian Peninsula, wind and solar together provide more than a quarter of the total electricity. In mid-western United States, wind power has a share of more than 25%. Some states in India and a number of Chinese provinces also have high share of renewables in total electricity supply. These numbers prove that despite challenges in technical system operation it is possible to run power systems reliable at very high penetration rates of wind and solar energy, something that was regularly challenges by certain observers until recently.
Figure 5. Share of wind and solar in total electricity consumption
Key point: In at least 10 European countries, wind and solar now supplies more than 10 percent of electricity demand. On the Iberian Peninsula, the share is more than 25 percent.
Source: OEE, based on data from IEA Electricity Statistics
More statistics. Several publications provide regular updates about the status of renewable energy in detail. Some major annual publications that provide this information are:
- IEA: Renewable Energy Medium-Term Market Report
- IRENA: Renewable Energy Statistics
- REN21: Renewables Global Status Report
2. Declining costs of wind and solar power
2.1 Estimating cost of wind and solar
Estimating costs. Most estimates of cost of wind and solar power use one of these two techniques: (1) estimate generation cost based on estimates of equipment and financing cost; (2) consider that true costs are reflected in the price quoted by power plant developers in auctions that buyers hold for procuring renewable energy. Neither approach is without problems. Using the first approach requires us to know the actual project costs – information that only investors possess. The second approach, of taking tender prices as cost of production, is also problematic because tender bids are not cost-reflective if they include strategic considerations or hidden subsidies. In general it is important to be mindful of the source of the data about costs while deriving any conclusions. In particular estimates from a single auction or project cannot, and should not, be generalized to reflect industry wide costs. Nevertheless, by considering information from various sources a trend can be constructed.
Declining costs. Measured by any metric, the cost of wind and solar power has decreased sharply during the past decade. Figure 6 displays the generation costs of onshore wind energy and those of solar PV, as derived from IRENA’s project-specific cost database. Figure 7 summarizes major recent auctions for renewable energy. Together, these figures present a compelling and robust fact: the cost of generating electricity from wind and solar energy has more halved in recent years. On an average, cost of wind power is now around USD 70 per MWh and solar power around USD 130 per MWh. Un-der favorable conditions, costs can be lower: in some cases investors have committed to provide wind and solar energy for less than USD 40 per MWh.
Figure 6. Levelized cost of electricity of onshore wind
Key point: The average levelized cost of wind power has decreased from $200/MWh to $70/MWh over the last 20 years.
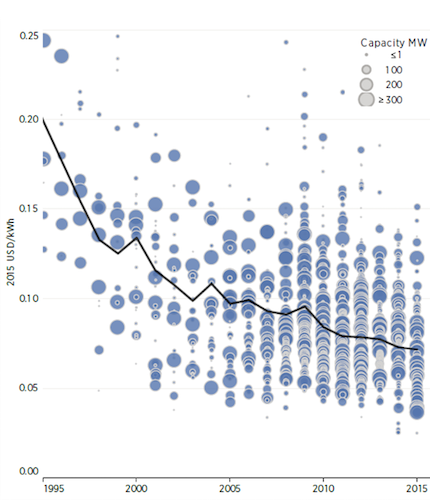
Source: IRENA Renewable Cost Database and analysis
Figure 7. Levelized cost of electricity of solar PV
Key point: The average levelized cost of solar power has reduced from $300/MWh to $130/MWh over the last 5 years.
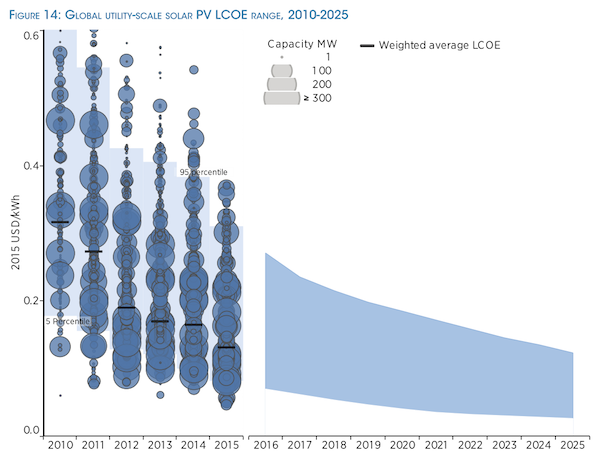
Source: IRENA Renewable Cost Database and analysis
Auction results. Figure 8 displays the outcome of selected tenders for renewable energy. In coun-tries with good wind and solar resources, such as some South American and Middle East countries, auctions have resulted the prices below USD 50 per MWh for both wind and solar energy. In countries with much less attractive resources, but low cost of capital, including several European countries, auc-tions have resulted in similarly low prices.
Figure 8. Tender results for renewable power
Key point: Investors now offer to supply renewable power for $30-70/MWh in many parts of the world.
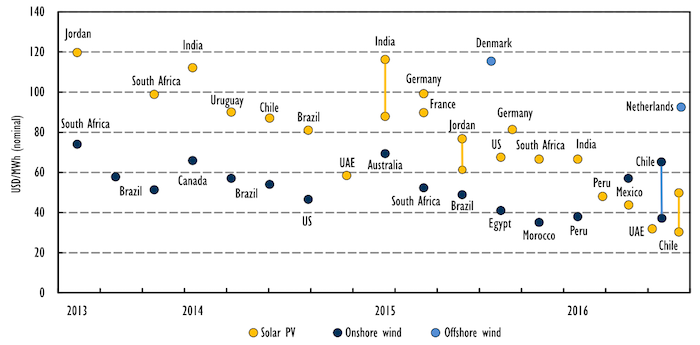
Source: IEA (2016): Medium term RES market report
2.2. Reasons for decline in cost of wind and solar power
In The cost of electricity, we defined levelized costs of electricity (LCOE) as the aggregated discounted lifetime cost of generating electricity per unit of output. It is calculated using the following formula:
\begin{equation} \label{eq:1} LCOE= \frac{C_{fix} + \sum_{y=1}^{Y}(1+r)^{-y} \cdot C_y} {\sum_{y=1}^{Y}(1+r)^{-y} \cdot G_y} \end{equation}
where LCOE is the levelized cost in EUR per MWh, Cfix is the investment cost incurred for setting up the project, Cy are other costs incurred in year y, r is the discount rate, Y is the technical lifetime in years, and Gy is electricity generation in MWh.
Levelized costs for RE. To clearly see the determinants of LCOE, we can rewrite equation (1) by explicitly acknowledging that for wind and solar energy, the only annual costs are O&M expenses, and that yearly generation can be written as the capacity factor times 8760 times installed capacity:
\begin{equation} \label{eq:2} LCOE= \frac{C_{fix} + \sum_{y=1}^{Y}(1+r)^{-y} \cdot C_{y(OM)} } {\sum_{y=1}^{Y}(1+r)^{-y} \cdot cf \cdot 8760} \end{equation}
We can now see that the levelized cost of electricity is a function of following:
Cfix: Investment costs per kW of installed capacity
Cy(OM): Annual operation and maintenance (O&M) expenses in year y
r: Weighted average cost of capital (WACC)
cf: Capacity factor
The dramatic reduction in cost of wind and solar power over the last decade has been possible because all the important determinants of generation cost changed favorably.
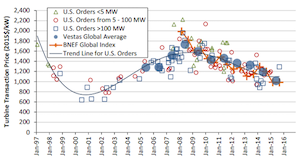
Investment costs. The cost of buying and installing wind turbines and solar photovoltaic (PV) modules has declined sharply in recent years. For example, onshore wind turbine prices have dropped by 30-50% since 2008, according to data gathered by the U.S. Department of Energy (DOE) and the consulting firm Bloomberg New Energy Finance (both time series are shown in Figure 9). It is interesting to note, however, that turbine prices had been increasing during the decade before, driven by high demand for turbines and high prices of raw materials such as copper and steel.
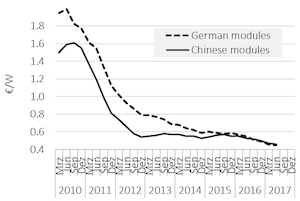
The price decline for solar PV has been more dramatic. Led by a reduction in price of solar modules by 80%, the price of a small-scale rooftop solar system in Germany has declined by 75% since 2006, according to data from Germany’s Bundesverband Solarwirtschaft. Solar modules can be easily shipped around the world hence their prices (before taxes and tariffs) are quite uniform across the world. Cost of installing the modules varies with the size of installation and the market conditions. The reduction in price of wind turbines and solar modules has been driven by intense competition among suppliers, economies of scale in production and technological advances that have reduced manufacturing costs.
| Figure 9. Price of onshore wind turbines | Figure 10. Price of solar modules |
|---|---|
| Key point: Cost of wind turbines has reduced since 2010. | Key point: Solar module prices have declined by more than 80%. |
 |
 |
| Source: DOE (2016): Wind power market report | Source: Fraunhofer ISE 2017 - Photovoltaics Report |
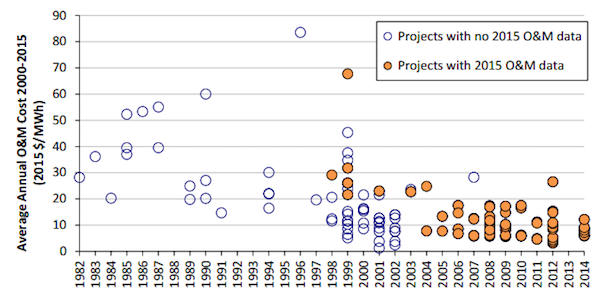
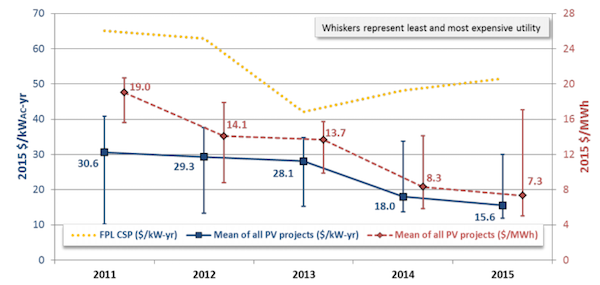
Operation and maintenance (O&M) expenses. Along with the reduction in cost of equipment maintenance costs for wind and solar power plants have declined substantially over the last decade. The reduction is especially noteworthy in case of wind power. Innovations such as predictive mainte-nance for turbines has helped reduce O&M costs for onshore wind from around USD 30 per MWh on an average to below USD 10 per MWh over the past decade, according to the United States Depart-ment of Energy (DOE), see Figure 10. Similarly, O&M costs for solar energy declined from USD 19 per MWh to USD 7 per MWh during the four years to 2015, according to LBNL (Figure 12).
Figure 11. O&M costs for U.S. onshore wind
Key point: Reliable technology and automation has dramatically reduced the cost operating and maintaining wind turbines.
Source: DOE (2016): Wind power market report
Figure 12. O&M cost for U.S. utility scale solar PV
Key point: O&M cost declined by half from 2011 to 2015
Source: LBNL (2015): Utility scale solar
Cost of capital. As we discussed in the chapter on Cost of Electricity, electricity generation in gen-eral, and renewable energy in particular, is highly capital-intensive. Over the last decade reduction in the cost of debt and equity has contributed to reducing the weighted average cost of capital (WACC) of renewable energy projects. On the debt side, the average benchmark real interest rates in G7 coun-tries declined from around 3.5% in 2000 to -0.5% in 2016 (Figure 13). While the interest cost faced by RE projects is higher, it has followed a similar trend. Similarly, with respect to equity, the return that investors expect on investment in renewable energy projects has also dropped. The decline in cost of equity reflects not only the overall weak economic environment (which reduces the opportunity cost of investment), but also reduction in the risk profile of the renewable investments. Policy makers across countries have strived to reduce market and regulatory risks faced by the sector. Investors now charge a lower risk premium for investing in renewable electricity, bringing down the expected rate of return on equity.
Figure 13. Average ten-year inflation indexed bond yields, G7 countries excluding Italy
Key point: RE has benefitted from low borrowing costs over the last 10 years
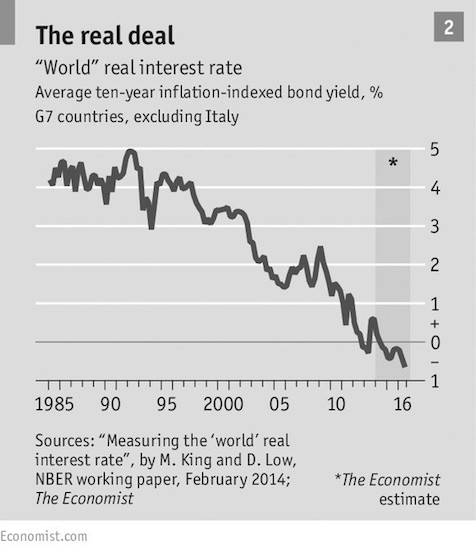
Source: The Economist
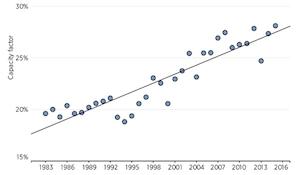
Capacity factor. Improvement in generation technology has increased the capacity factors achieved by renewable power plants. The increase has been particularly large in case of wind power: while ca-pacity factor of around 20 percent was common in the 1990s, average capacity factors for new onshore wind power plants is now as high as 30 percent. In other words, each kW of installed wind power capacity now generates 50% more energy than during the early years of that technology. In-crease in generation capacity per kW, along with reduction in total investment costs per kW, implies that each unit of electricity can now be produced more cheaply.
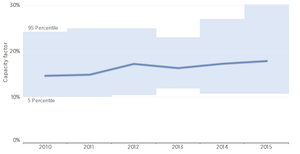
| Figure 14: Global average capacity factor for onshore wind additions | Figure 15: Global average capacity factors for utility-scale PV systems |
|---|---|
| Key point: On global average, wind power has now capacity factors of close to 30%, up from around 20% in the early years. | Key point: Capacity factors have improved with better tracking devices and shift to higher irradiation locations. |
 |
 |
| Source: IRENA (2016): The power to change: Cost reduction potential | Source: IRENA (2016): The power to change: Cost reduction potential |
Quantifying the four factors. It is easily understood that cheaper turbines, reduced O&M expenses, lower cost of capital and increased yield all help to bring down generation costs. But how much did each of these factors contribute?
| Onshore wind | 2008 | 2016 |
|---|---|---|
| Investment cost | 1600 €/kW | 1100 €/kW |
| O&M cost | 15 €/MWh | 8 €/MWh |
| Discount rate | 8.3% | 3.9% |
| Capacity factor | 23% | 28% |
Source: OEE, based on sources of figures referenced above
The table above provides rough estimates for global average LCOE of onshore wind and solar PV in 2008 and in 2017. The figure also shows the contribution of the four factors to this decline. Levelized cost of wind energy declined by more than 40%, and the cost of solar PV by more than 80%. An im-portant reason for this was the decline in equipment cost. While it clearly the most important reason for the solar cost drop, the decline in cost of capital is of similar importance for wind energy. Increased capacity factors also contributed significantly, particularly in the case of wind.
Figure 16. Estimates of LCOE for onshore wind and solar PV in 2008 and in 2017, and contribution of individual cost drivers
Key point: Cheaper equipment has been most important in reducing costs but other factors – in particular reduced cost of capital – have also been important.
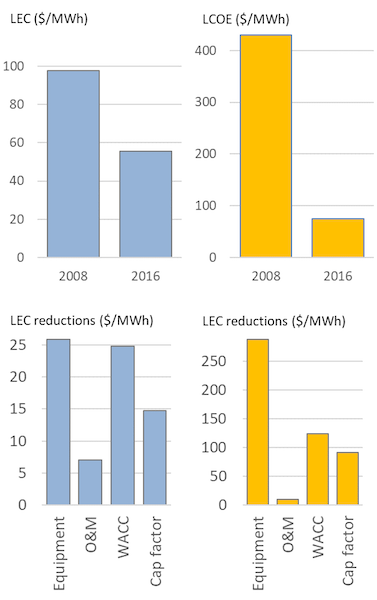
Source: IRENA (2015)
More statistics. Regular update on costs of renewable generation technologies are provided in the following publications:
- IEA: Renwables 2017 (formerly Renewable Energy Medium-Term Market Report), paywalled
- IRENA: Costing reports
- LBNL: Tracking the Sun (small-scale solar in the U.S.)
- LBNL: Utility-Scale Solar
- NREL: PV System Cost Benchmarks
- Fraunhofer ISE: Photovoltaics report
2.3 Learning curves
Macroeconomic reasons and de-risking policies are important drivers behind the reduced cost of capi-tal. The dominating underlying reason for the other three factors – cheaper equipment, reduced O&M cost and increased capacity factors – is better and cheaper technology.
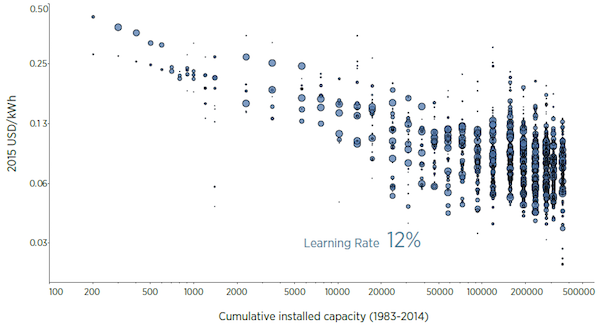
Learning curves. Dropping equipment prices are often graphically depicted as a “learning curve” or “experience curve”. In industry circles it is common to talk about the “learning rate”: this is the rate at which the cost of production declines each time the cumulative global production of a technology doubles. Figure 17 and Figure 18 depict estimates of learning curves for onshore wind and solar PV. According to these estimates, doubling cumulative wind capacity reduces manufacturing costs by 12%; doubling crystalline solar PV capacity brings costs down by 29%.
Figure 17. Learning curve for onshore wind
Key point: Increase in production capacity reduces cost of manufacturing
Source: IRENA (2015)
Figure 18. Learning curve for solar PV
Key point: Increase in production capacity reduces cost of manufacturing
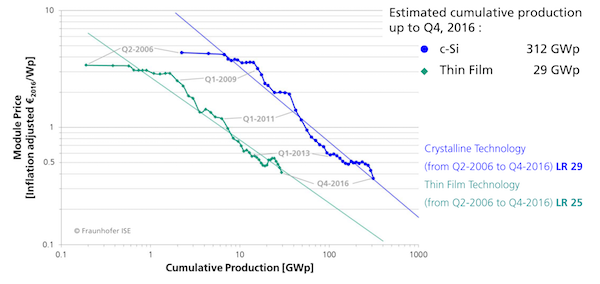
Source: Fraunhofer ISE 2017
The reasons behind better technology. It should be noted that the concept of a learning curve is purely empirical and descriptive. It does not explain how and why learning is happening, nor does it give a reason why it should happen at a constant rate for each doubling of cumulative production. There are two principle reasons why wind turbines and solar modules are today cheaper and more reliable than a decade ago: economies of scale and technological learning.